Built from primary data: FRED, the US Treasury, market feeds. Cream paper, one story per chart, handwritten where a line needs a voice. Free to share with credit.
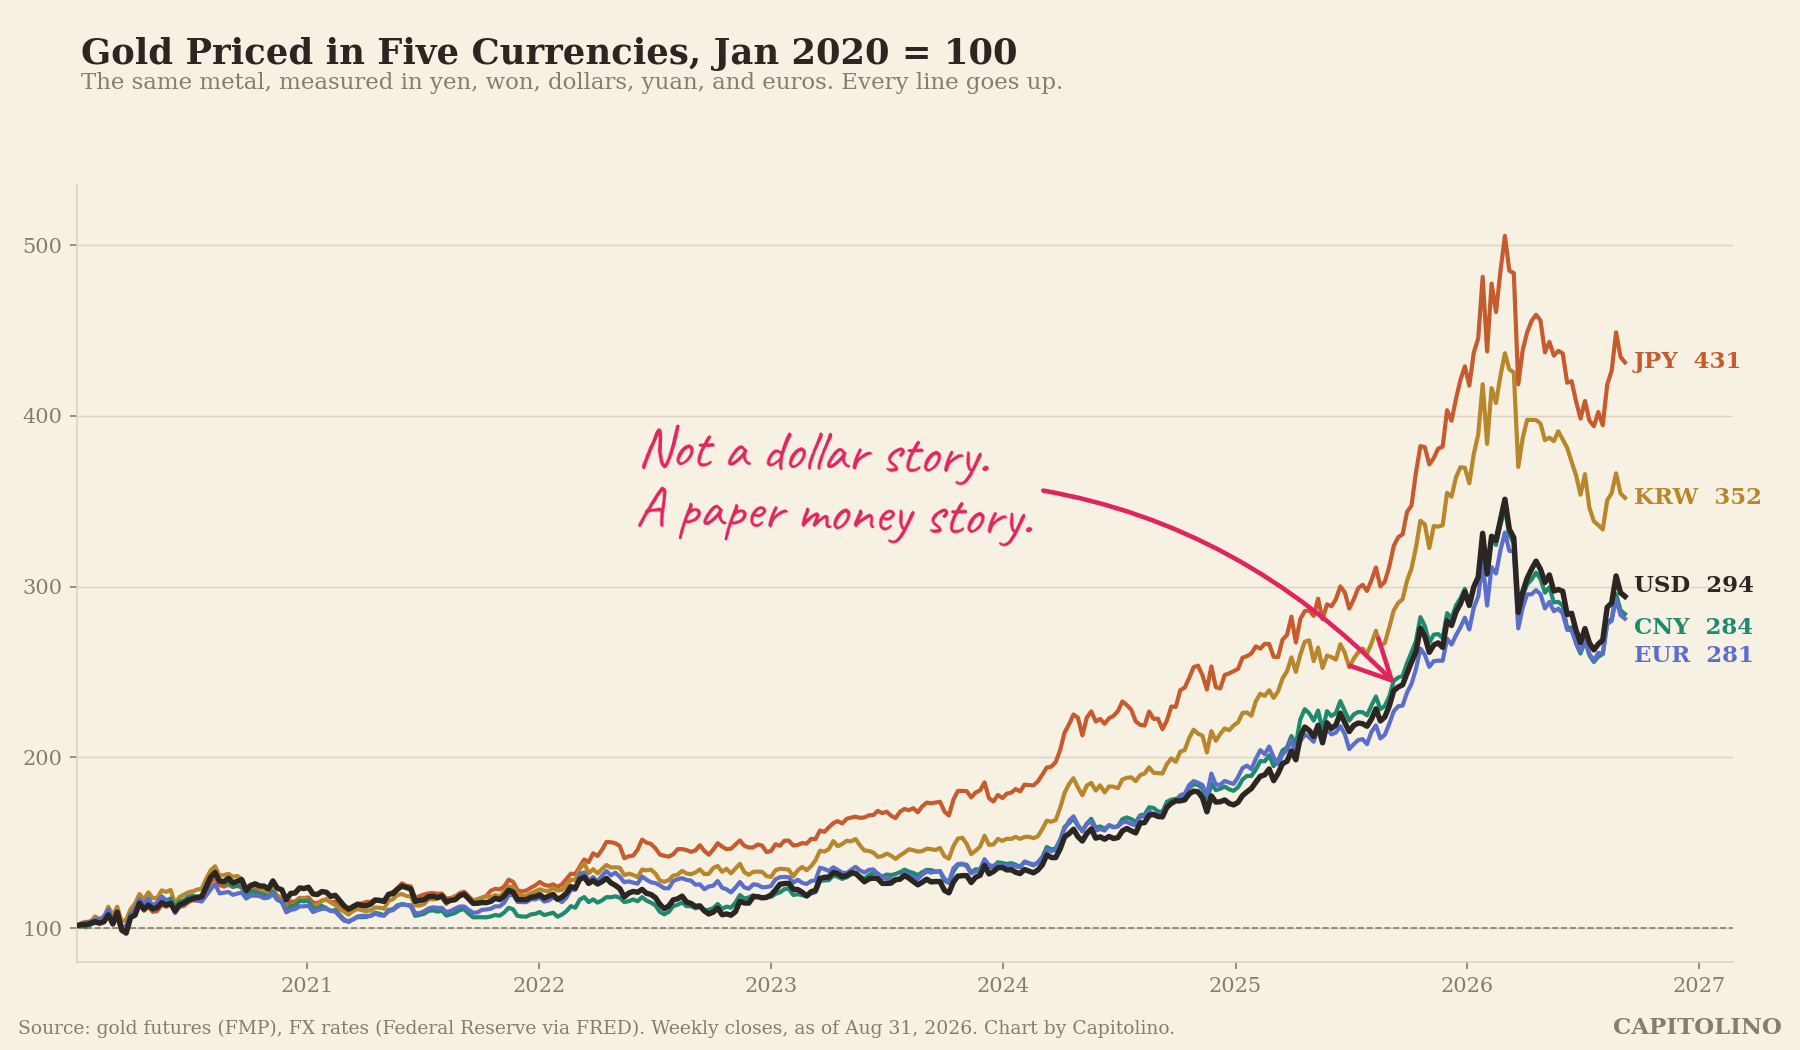
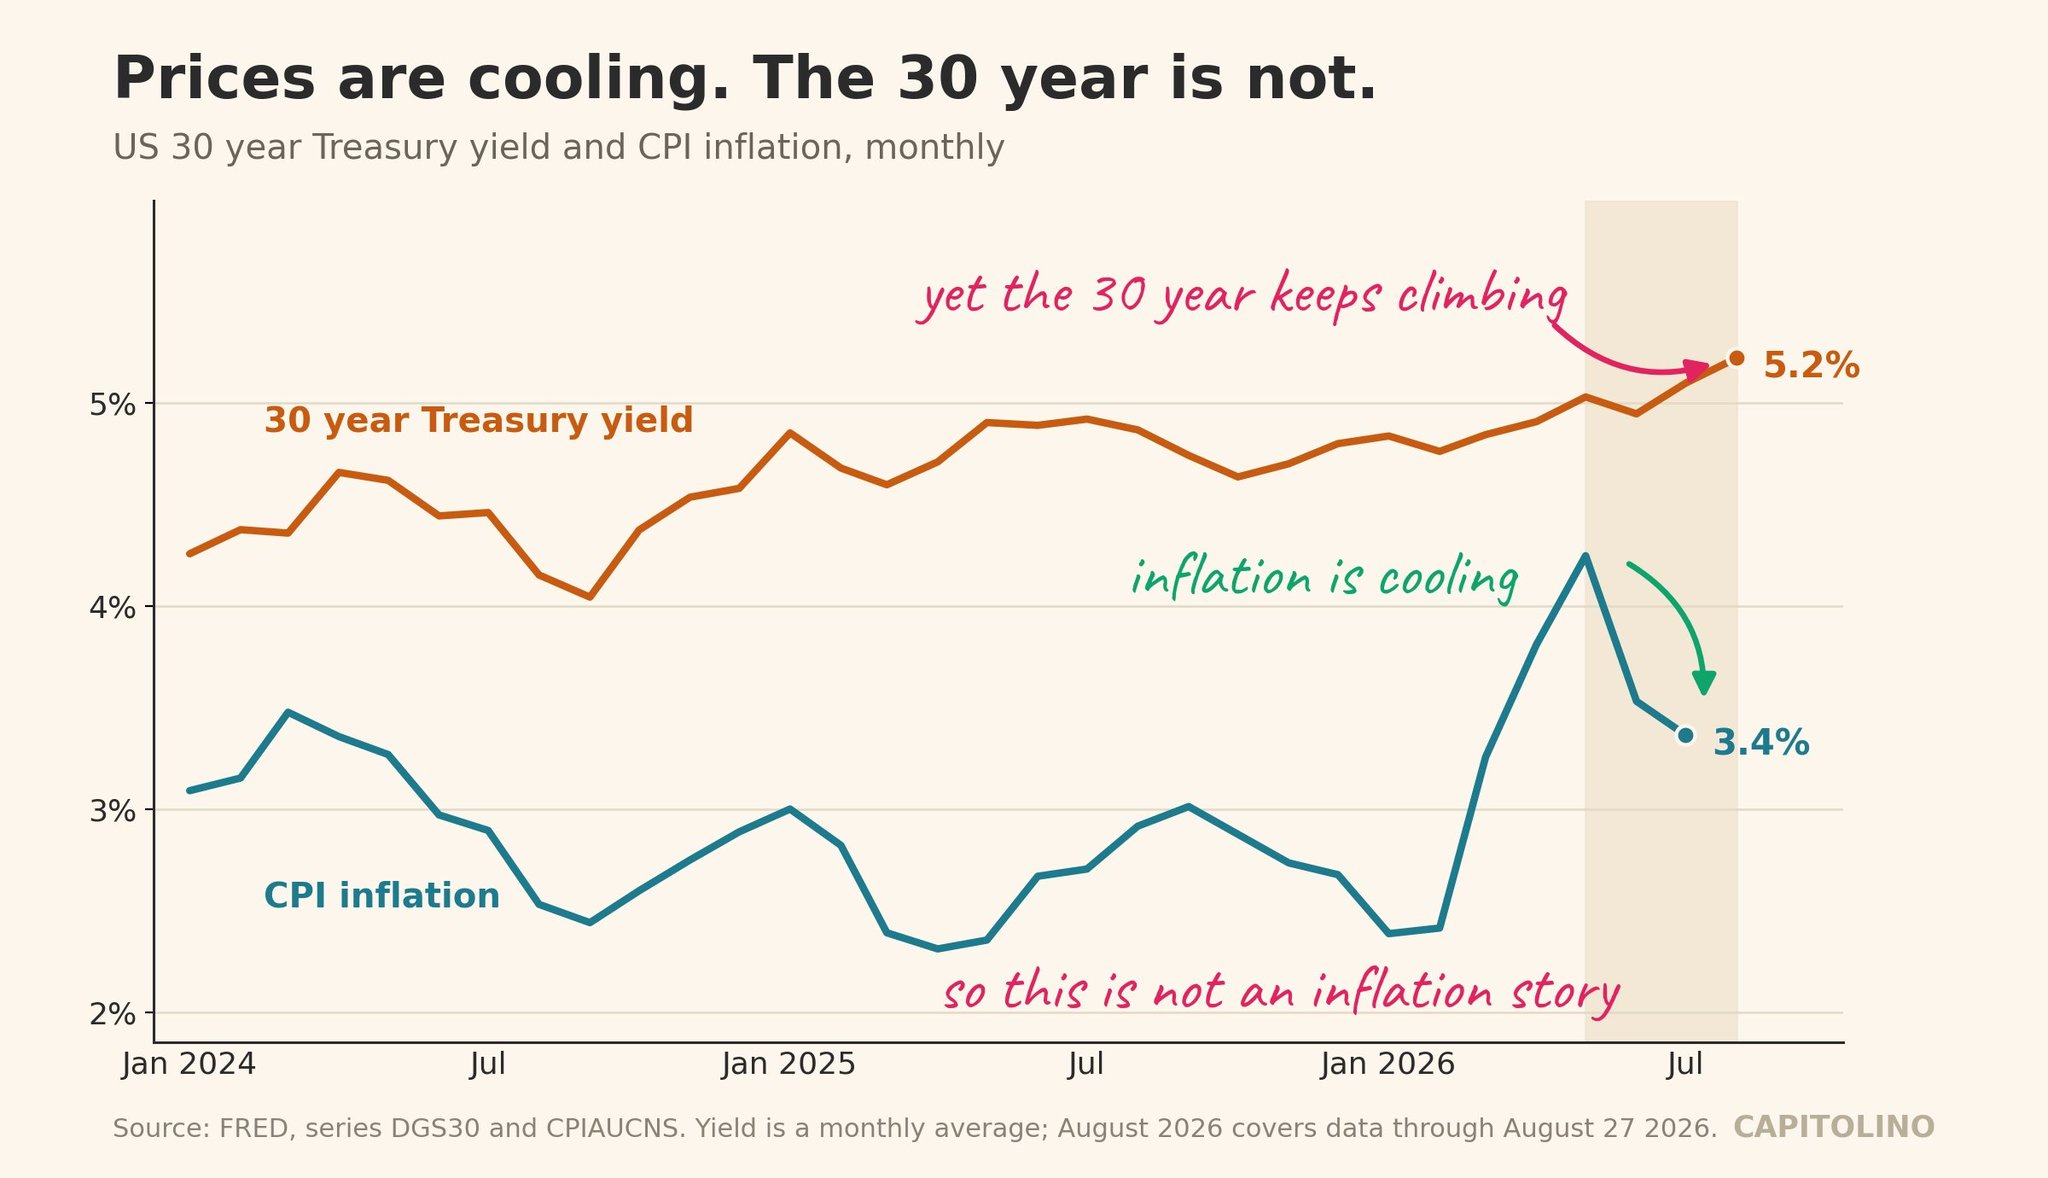
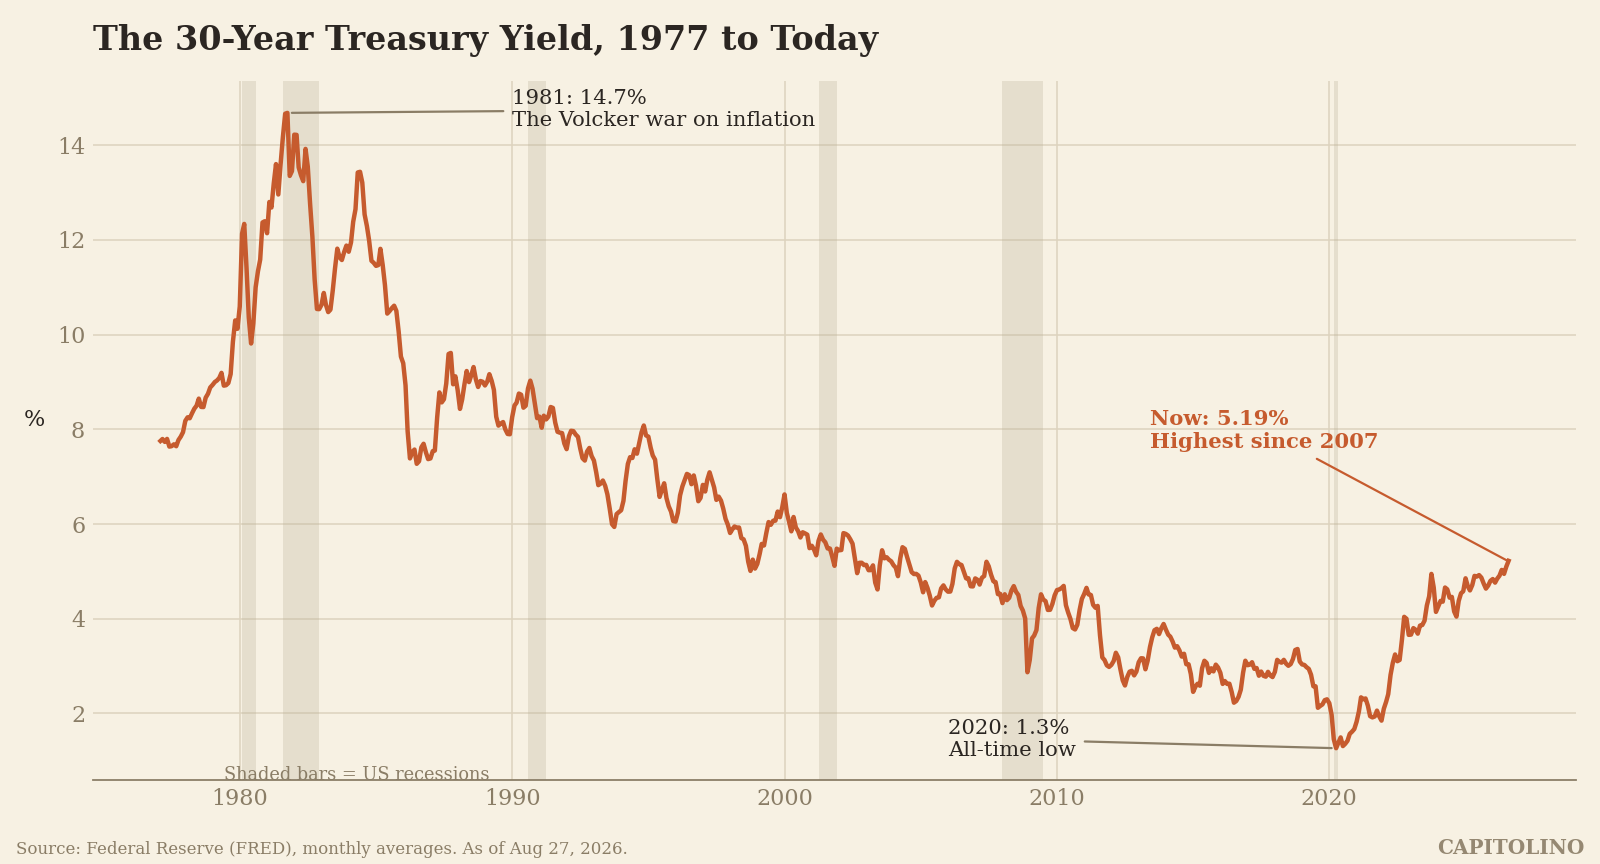
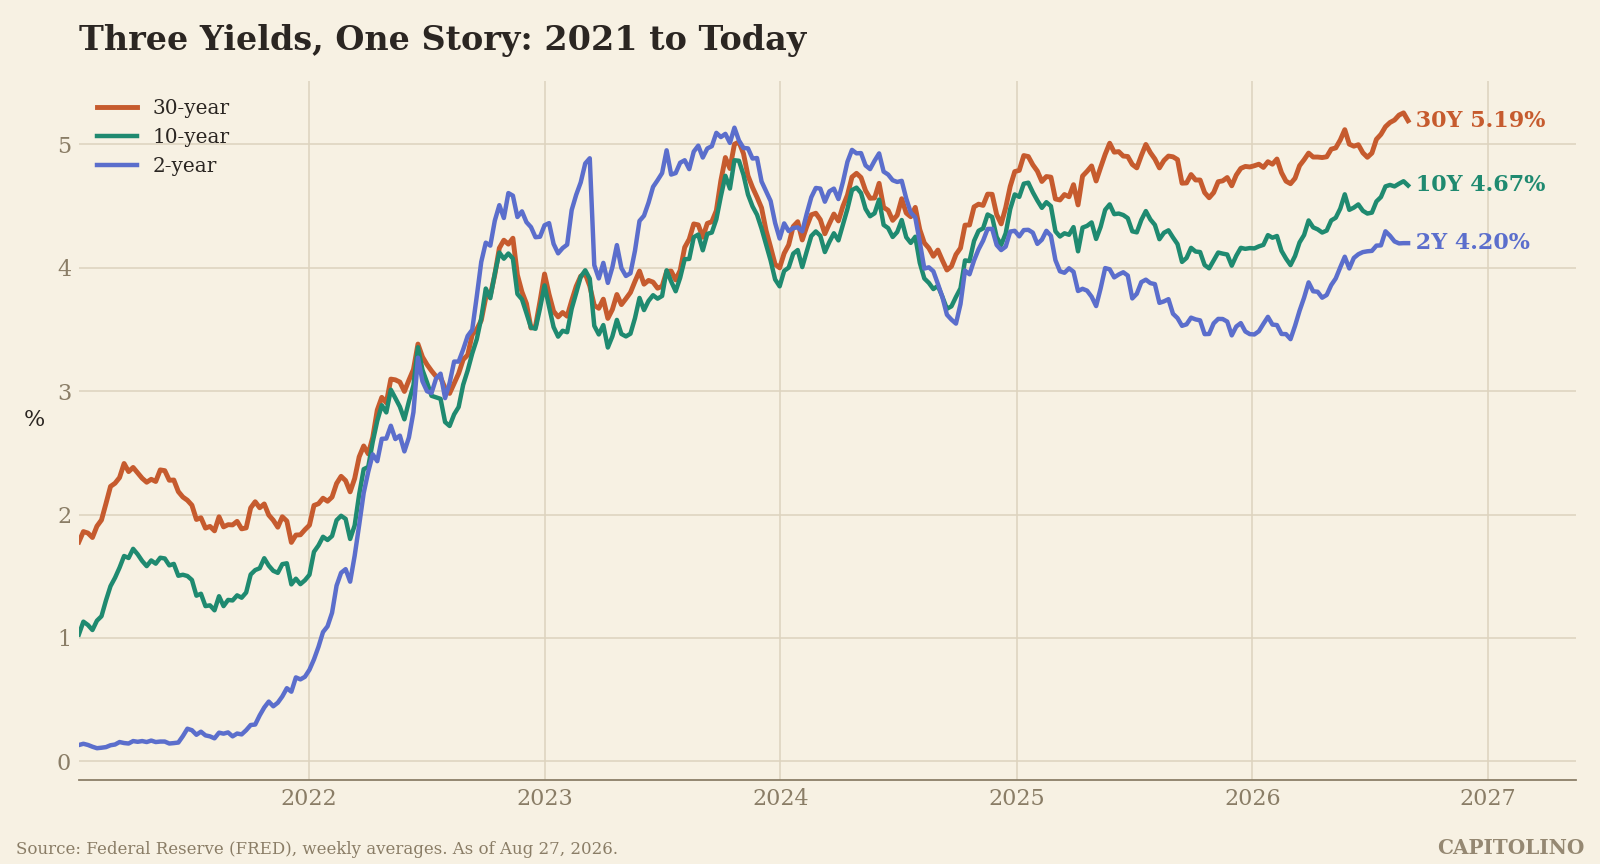
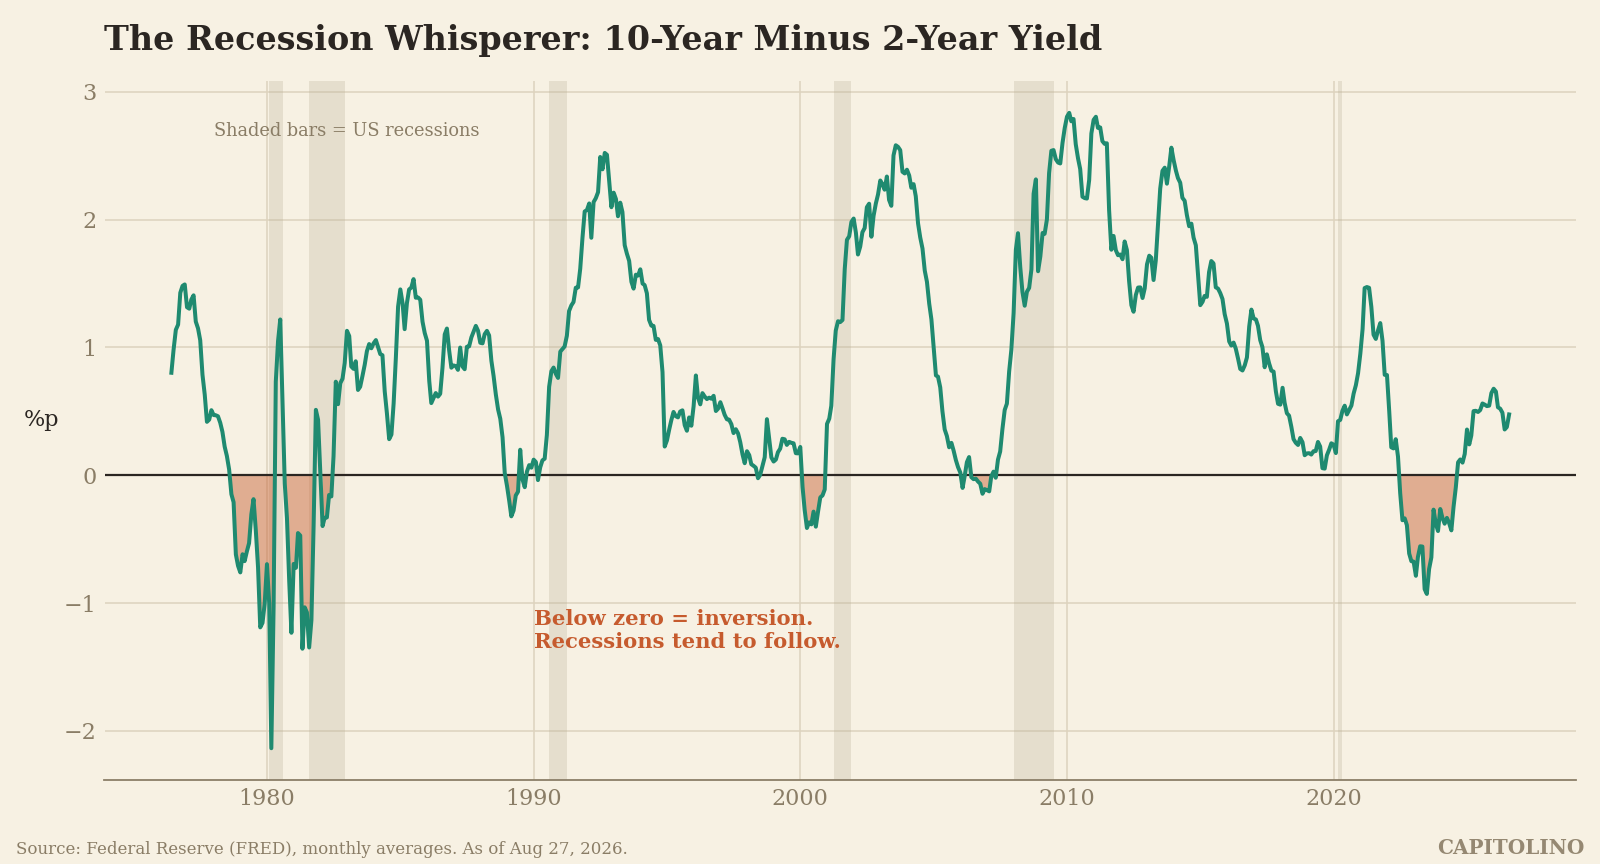
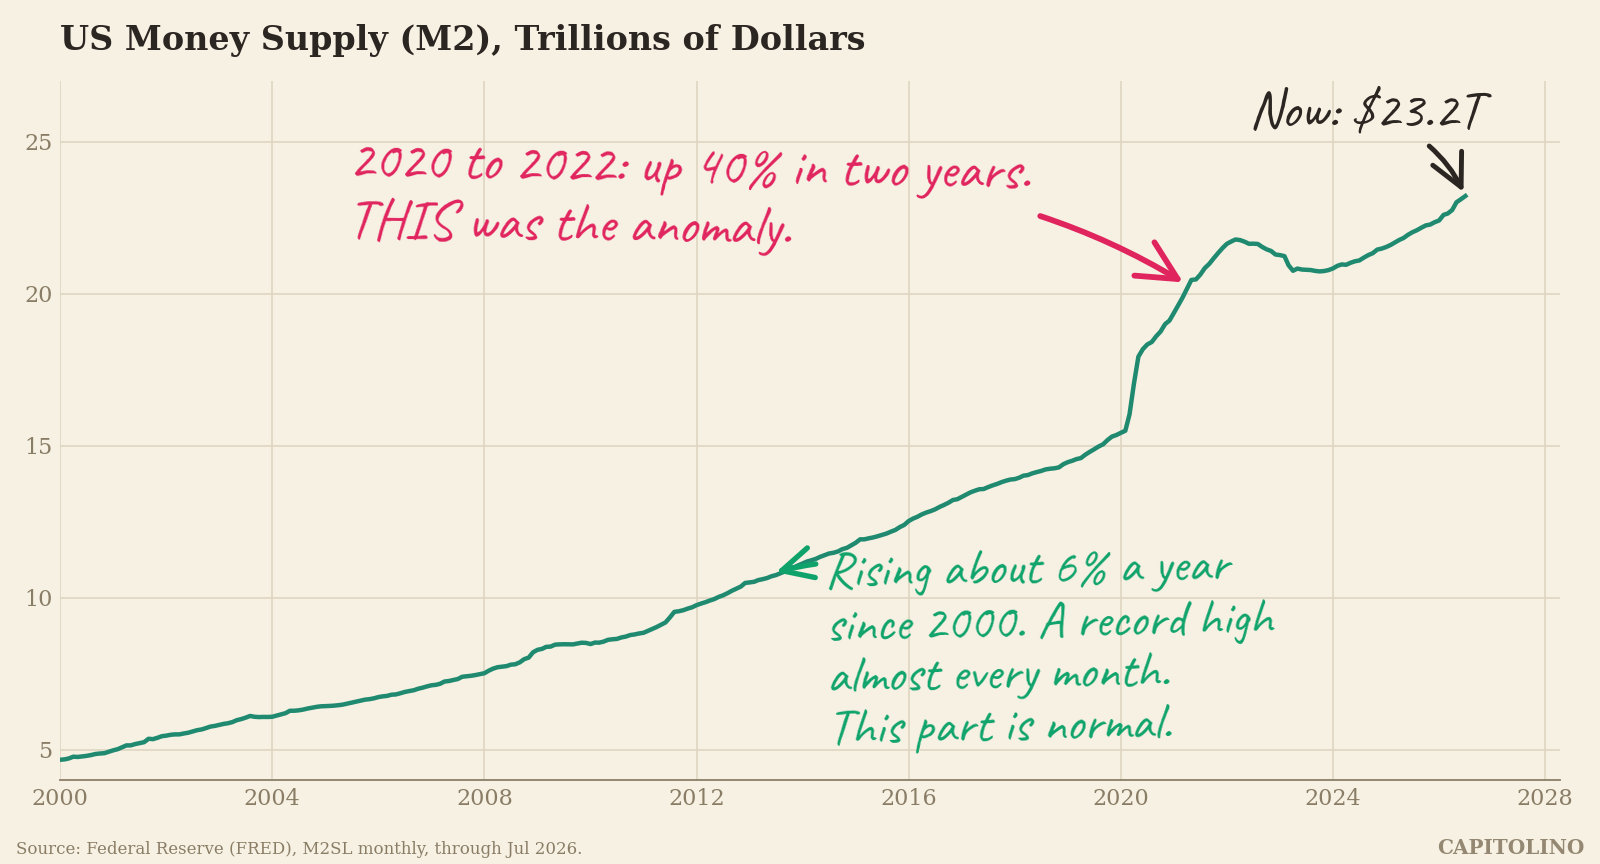
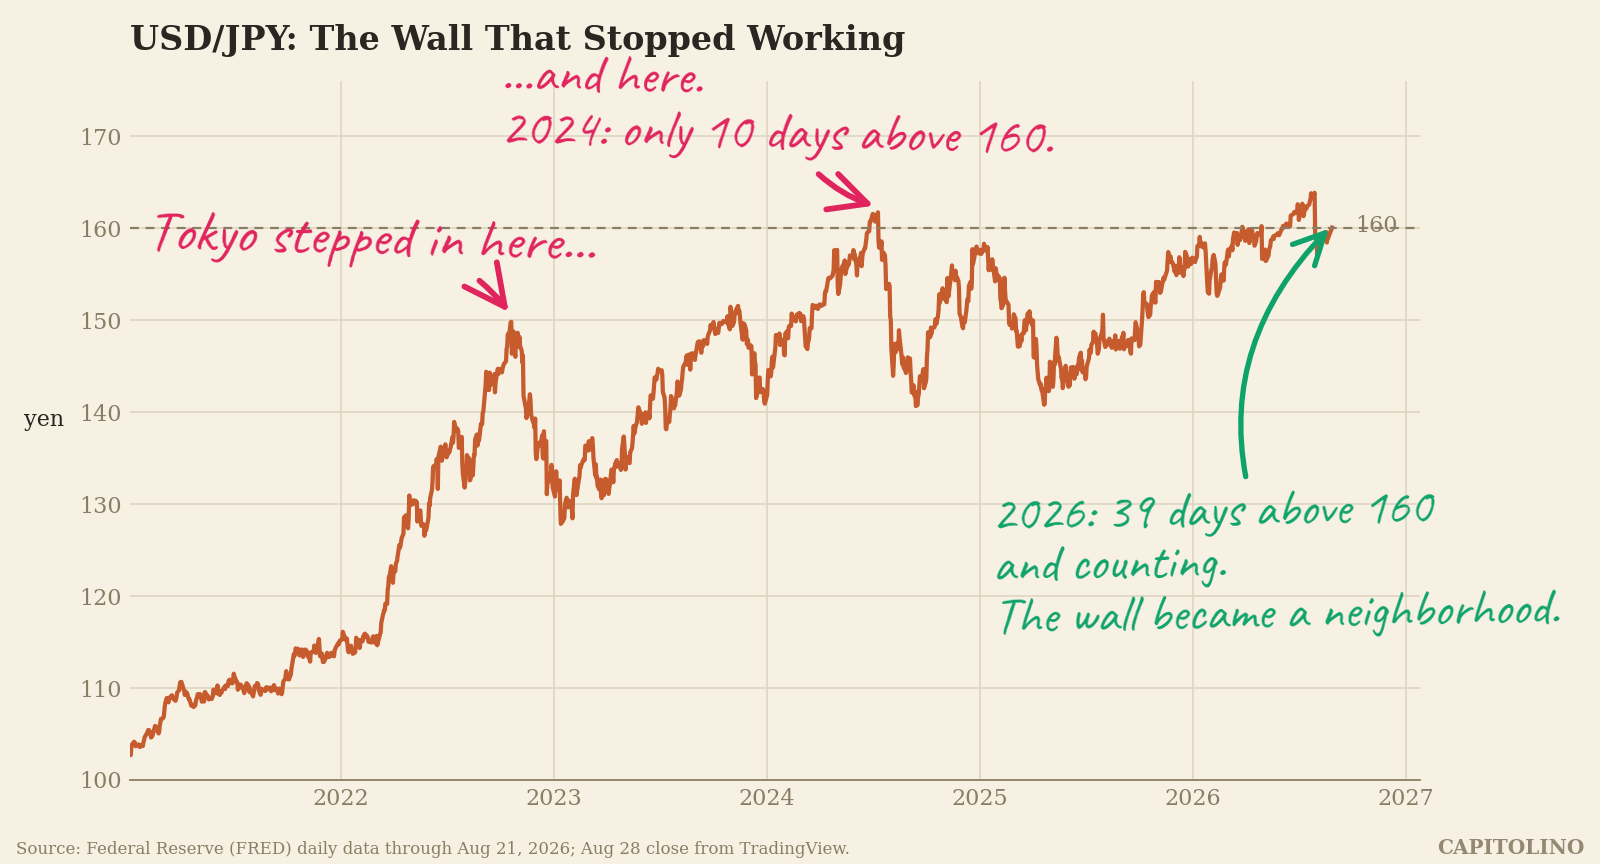
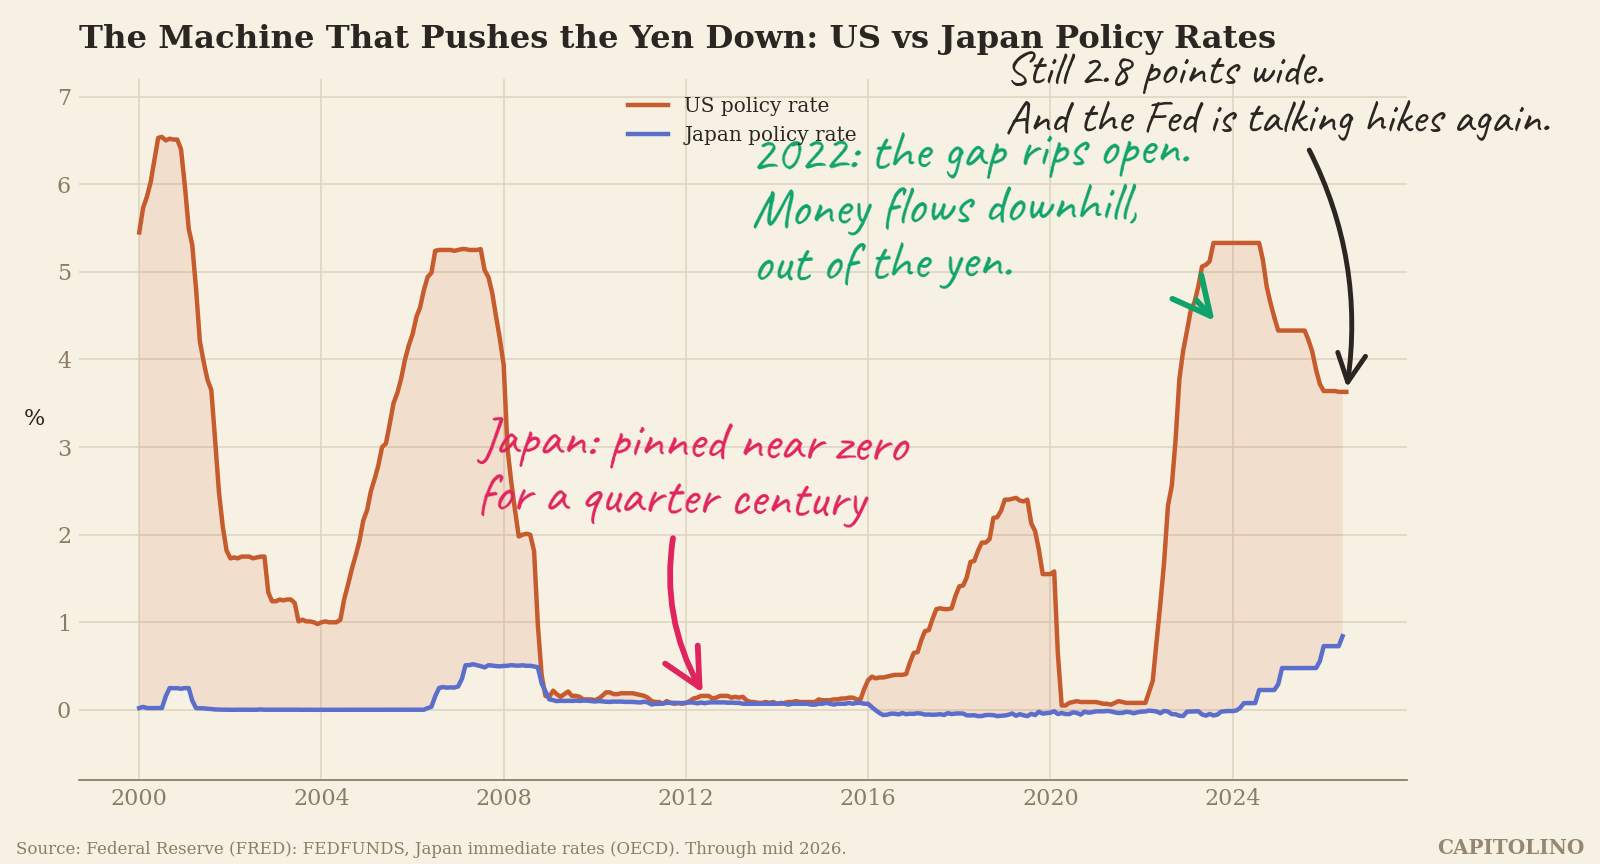
Gold Priced in Five Currencies Jan 2020 = 100. Every line goes up.30 Year Yield vs CPI Prices cooling, borrowing cost rising.The 30 Year Treasury Yield, 1977 to Today Half a century in one line.Three Maturities, One Story 2, 10, and 30 year yields.The Recession Whisperer 10 year minus 2 year, recessions shaded.US Money Supply (M2) 23.2 trillion dollars and a handwritten note.USD/JPY and the 160 Line Days above 160, 2024 vs 2026.US vs Japan Policy Rate Gap Why the yen fell.